Excalidraw: create and share workflow diagrams with end-to-end encryption
Excalidraw might be my new go-to open-source tool over draw.io for creating and sharing workflow diagrams. It's simple, fast, aesthetically pleasing, and has amazing VS Code integration.
I recently stumbled across Phil Ewels’s ~18 minute nf-core/bytesize talk on Excalidraw:
For years I’ve been using draw.io for making flowcharts and diagrams for documentation, papers, presentations, and for general brainstorming and communication with my team, clients, and collaborators.1 Excalidraw (excalidraw.com) looks like an attractive alternative. It’s free, open-source, and end-to-end encrypted.2 It has all the normal features you’d expect from something like drawio, Lucidchart, etc.: connectors snap to objects, moving objects around makes the connectors move with them, export to PNG, SVG, etc.
The default aesthetic is a kind of scrappy, hand-drawn look. Which can be nice because if boxes aren’t perfectly lined up or arrows throughout the diagram aren’t perfectly symmetrical, it still looks good. Personally I love this — when I’m creating diagrams in draw.io and all the boxes are perfectly square, I spend far too much time getting all the alignment and symmetry just so, even if I’m not creating something for publication or distribution.
And, if you do need that perfect symmetry without the hand-drawn look, you can CMD-A to select everything and turn the scrappiness off and change the font to a normal sans serif font, and use the keyboard shortcuts for aligning selected objects.
Comparison to draw.io
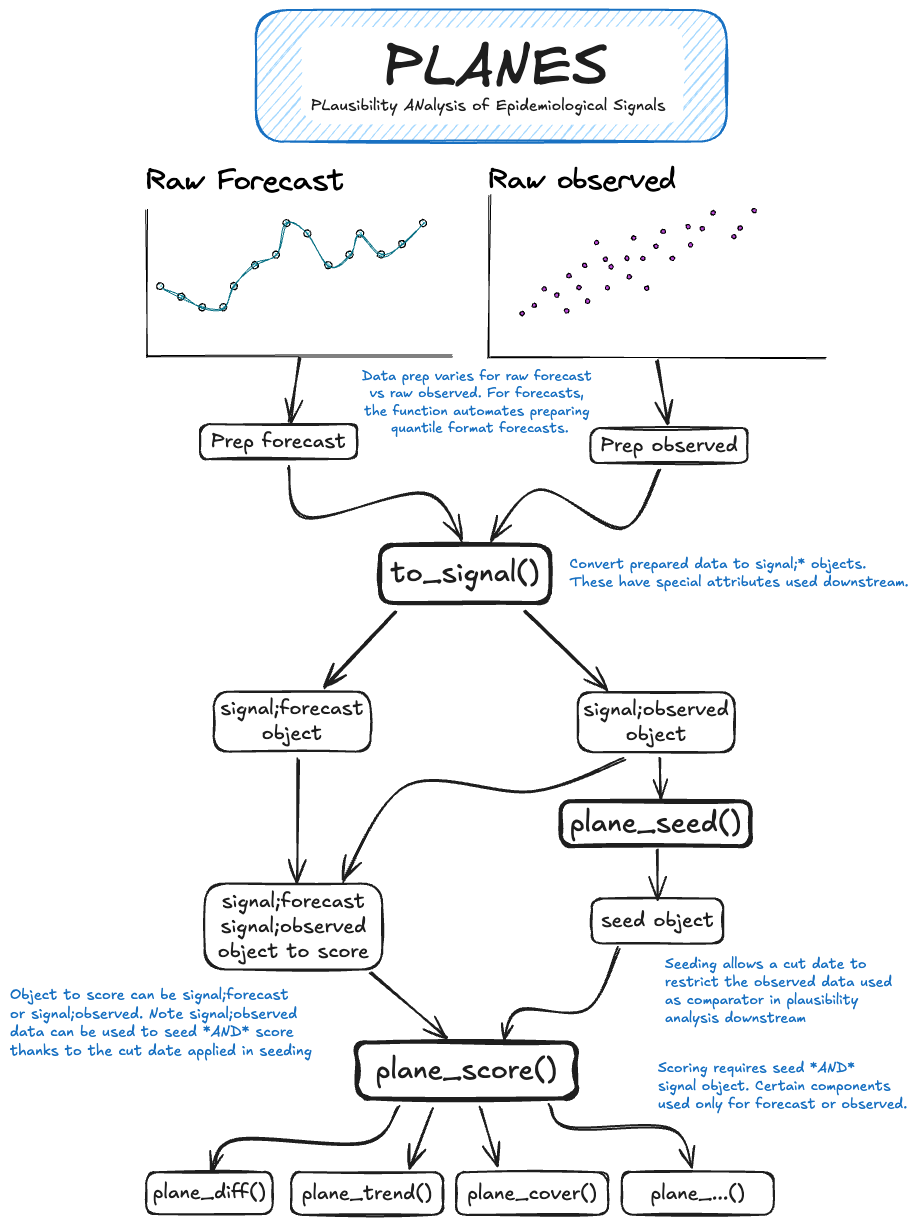
I made an Excalidraw version of the PLANES/rplanes package API (see previous post):

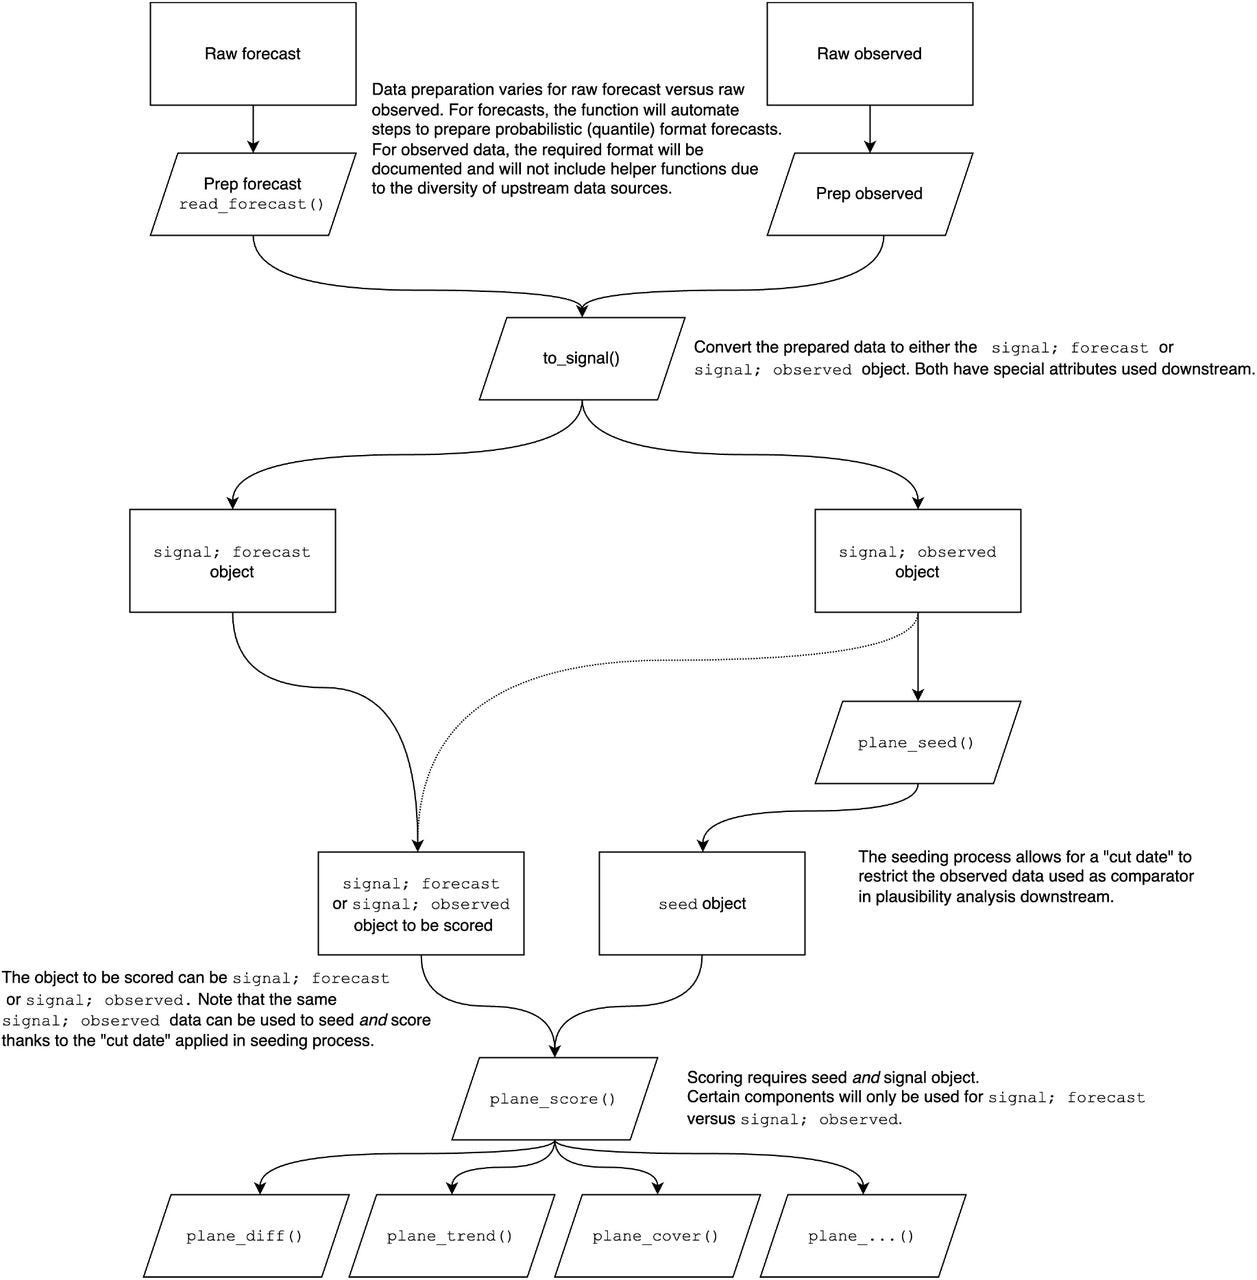
Contrast this with the original version in the previous post, from the paper, below.

Excalidraw lets you share a drawing via a URL that’s end-to-end encrypted. You can play around with the diagram above at this link, without impacting my copy.
VS Code integration
Here’s where things get interesting. If you install the Excalidraw VS Code extension, you can create a blank file with the extension .excalidraw, .excalidraw.svg or .excalidraw.png, and when you click on the file in VS Code you get a full Excalidraw editor in VS Code. And, Excalidraw does some slick things with PNG headers to make the file version controllable and diffable with git, so you can stick this into your repo and others on your team can work on it together.
AI: Text to diagram
Because nothing is complete these days without some genAI sprinkled in, Excalidraw also has an experimental text-to-diagram tool in the editor. I asked for a diagram illustrating “variant calling with the GATK best practices”:
It’s obviously not very detailed, but it’s not a bad start, for a tool that was never purpose-built for bioinformatics or genomics. You get back a start to a diagram you can continue to edit as needed.
Mermaid to Excalidraw
Mermaid (mermaid.js.org) is a “JavaScript based diagramming and charting tool that renders Markdown-inspired text definitions to create and modify diagrams dynamically.” The syntax is relatively straightforward, the docs are good, and for years now GitHub allows you to include mermaid diagrams in your GitHub markdown files.
The Excalidraw editor has the ability to take Mermaid code and generate an Excalidraw diagram. I created an example below for a made-up single-cell RNA-seq workflow. Here’s the Mermaid code:
graph TD
    A[Sample Preparation] --> B[Single-cell Isolation]
    B --> C[cDNA Synthesis and Library Preparation]
    C --> D[Sequencing]
    D --> E[Read Quality Control]
    E --> F{Read Quality Control Subpanel}

    F --> F1[1. Remove Adapters]
    F --> F2[2. Trim Low-quality Bases]
    F --> F3[3. Filter Low-quality Reads]
    F --> F4[4. Estimate Sequence Quality]
    F --> F5[5. Check Read Length Distribution]
    F --> F6[6. Assess GC Content]
    F --> F7[7. Identify Contaminants]

    E --> G[Read Alignment]
    G --> H[Transcript Quantification]
    H --> I[Data Normalization]
    I --> J[Dimensionality Reduction]
    J --> K[Clustering]
    K --> L[Cell Type Identification]
    L --> M[Differential Expression Analysis]
    M --> N[Pathway Analysis]
And here’s the resulting diagram. Some of the arrows could be tweaked, but it’s otherwise a great start.
Public and custom libraries
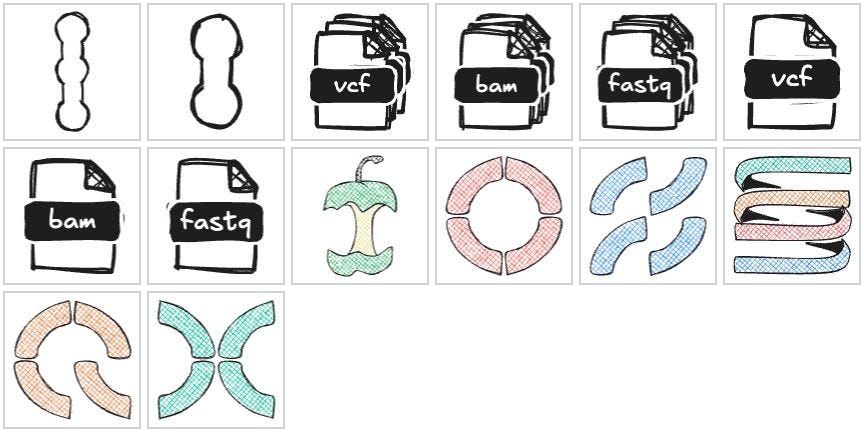
The default editor has basic shapes and connectors that’ll be sufficient for most quick diagrams. At libraries.excalidraw.com you can find hundreds of publicly available libraries of icons (all MIT licensed) that you can pull into your workspace and use. These include icon sets for software architecture diagrams, software logos (Slack, Docker, Kubernetes, Postgres, Redis, etc.), xkcd-style stick figures, basic UX/wireframing elements, and more. There’s currently an open pull request into excalidraw/excalidraw-libraries that will bring along icons for common bioinformatics file types, and the Nextflow/nf-core/MultiQC/Seqera icons. The docs on GitHub provide information on creating your own library.

Learning more
If you haven’t yet watched Phil’s nf-core/bytesize talk, go do so. It’s short, and illustrates everything I discussed in this post.
Also check out Excalidraw’s YouTube channel at youtube.com/@excalidraw for additional tutorials and feature demonstrations.
I used to do this the hard way in Powerpoint, then later in Visio. Then LucidChart came on the scene. After LucidChart became enshittified I discovered draw.io as a perfect drop-in replacement. After playing around with Excalidraw for an hour, I think it’ll be my go-to tool for making diagrams like this in the future.
The way Excalidraw pulls off E2EE is pretty slick, putting encryption keys in the URL after the # so that it doesn’t get sent to the server, but is readable from the client-side JavaScript code. See https://blog.excalidraw.com/end-to-end-encryption/ for details.


thnaks